A. Bottom-Up Investing
An investment approach that de-emphasizes the significance of
economic and market cycles. This approach
focuses on the analysis of individual stocks. In bottom-up investing,
therefore, the investor focuses his or her attention on a specific company
rather than on the industry in which that company operates or on the economy as
a whole.
BREAKING DOWN 'Bottom-Up Investing'
The
bottom-up approach assumes that individual companies can do well even in an
industry that is not performing very well. This is the opposite of
"top-down investing". Making sound decisions based on a
bottom-up investing strategy entails a thorough review of the
company in question. This includes becoming familiar with the company's
products and services, its financial stability and its research reports.
B. Top-Down Investing
Top-down investing is an investment approach that involves
looking at the "big picture" in the economy and financial world and
then breaking those components down into finer details. After looking at the
big picture conditions around the world, the different industrial sectors are
analyzed in order to select those that are forecasted to outperform the market.
From this point, the stocks of specific companies are further analyzed and
those that are believed to be successful are chosen as investments.
BREAKING DOWN 'Top-Down
Investing'
An investor may
use different criteria when deciding to employ the top-down approach. For
example, an investor may consider such factors as geography, sector and size.
What is important with this approach is that a big picture perspective is taken
first before looking at the details. Although there is some debate as to
whether the top-down approachis better than the bottom-up approach,
many investors have found the top-down approach useful in determining the most
promising sectors in a given market.
C. Intrinsic Value
The intrinsic value is the actual value of a company or an
asset based on an underlying perception of its true value including all aspects
of the business, in terms of both tangible and intangible factors. This value
may or may not be the same as the current market
value. Value investors use a variety
of analytical techniques in order to estimate the intrinsic value of securities
in hopes of finding investments where the true value of the investment exceeds
its current market value.
BREAKING DOWN 'Intrinsic
Value'
1. For
example, value investors that follow fundamental analysis look at both qualitative (business
model, governance, target market factors etc.) and quantitative
(ratios, financial statement analysis, etc.) aspects of a business to
see if the business is currently out of favor with the market and is really
worth much more than its current valuation.
D. Capital Asset Pricing Model
The
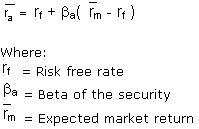
capital asset pricing model (CAPM) is a model that describes the relationship
between risk and expected return and that is used in the pricing of
risky securities.

The
general idea behind CAPM is that investors need to be compensated in two
ways: time value of money and risk. The time value of money is
represented by the risk-free (rf) rate in the formula and compensates the
investors for placing money in any investment over a period of time. The other
half of the formula represents risk and calculates the amount of compensation
the investor needs for taking on additional risk. This is calculated by taking
a risk measure (beta) that compares the returns of the asset to the market over
a period of time and to the market premium (Rm-rf).
BREAKING DOWN 'Capital
Asset Pricing Model - CAPM'
The
CAPM says that the expected return of a security or a portfolio equals the rate on a risk-free security plus
a risk premium. If this expected return does not meet or beat
the required return, then the investment should not be undertaken. The security market
line plots the results of the CAPM for all different risks
(betas).
Using
the CAPM model and the following assumptions, we can compute the expected
return of a stock in this CAPM example: if the risk-free rate is 3%, the beta (risk
measure) of the stock is 2 and the expected market return over the period is 10%,
the stock is expected to return 17% (3%+2(10%-3%)).